When we first thought of building dedicated application development templates for multiple frameworks, we tried to cover the ones that had the greatest potential and users could find the most helpful.
Uno Platform gets the job done by allowing developers to build applications supported by multiple platforms, using a single code source, not bad right?
Imagine combining LightningChart JS next generation, world’s fastest charts with this multi-platform framework and deploying it to WinUI and Android environments. It opens up a ton of possibilities for data visualization-driven applications!
What is LightningChart?
If you aren’t yet familiar with the library, LightningChart are advanced charting controls for desktop, web, and mobile development that are known for being the world’s fastest data visualization controls.
What is special about LightningChart charting controls is the ultra-high performance and ultimate capabilities that make every chart in the library behave only at its best.
The success of LightningChart is based on GPU acceleration, the highest real-time rendering performance, and the latest state-of-the-art UI interactions.
Particularly, LightningChart for JavaScript is fully GPU-accelerated and has WebGL-based rendering capabilities that assist the devices’ graphic processors to be used efficiently whilst securing the highest refresh rates to produce the smoothest animations.
Among the industries that implemented LightningChart are the medical applications sector where the library is crucial for ECG monitoring, the industrial sector where vibration analysis is vital to monitor and prevent machinery behavior as well as motorsports, trading & finance, aerospace and defense, and a lot more!
Think about it for a minute, how about creating advanced and data-driven applications with the help of LightningChart that are cross-platform and required a single source code with the help of Uno Platform?
Fastest & High-Performance Data Visualization Components for Uno Platform
Example 1 – JavaScript Spectrogram XY-Projection Chart
In this example, you can see how a 2D spectrogram chart is created which contains 1024 x 1024 = 1 million data points.
This spectrogram chart contains X and Y line projects that reflect the latest mouse coordinate result of a custom interaction.

So, when a user hovers over the 2D spectrogram, 1024 + 1024 data points are selected from the data set which are pushed to X and Y projections line series.
This is an expensive operation that can be quickly handled with calls to the LineSeries.clear().add(data).
Find this example within the LightningChart JS framework development template for Uno Platform.

Example 2 – 3D Box Series Rounded Edges
The next example is an animated 3D Bar Chart with bars that are colored dynamically based on their height and can be created with the LightningChart JS framework development template for Uno Platform.

To render the chart, use BoxSeries3D, which is a series type capable of rendering any number of Boxes and allows independent levels of formatting, for instance, independently modifying each Box’s location, size, or color at any point during the render.

The examples also showcase the rounded edges feature in both desktop and mobile view. While enabled by default, it can be adjusted and disabled at any time with BoxSeries3D.setRoundedEdges
Example 3 – Large Line Chart
In this example, the line chart visualization contains a relatively large dataset with several million data points.

The possibilities of web data visualizations available with LightningChart + Uno Platform dedicated framework development template are tremendously wide.
Previously, a line chart visualization was only possible to achieve at ranges of only hundred thousand of data points and even then, it required a complex development work in order to enable basic UX interaction such as zooming or panning with fairly decent performance.
It is possible to visualize up to a million points with the line chart visualization which is loaded in less than a second and the output includes incredibly high performance with immediate response to zooming and panning interactions.
How to Get Started with LightningChart’s Free Application Development Template for Uno Platform
Here is a step-by-step guide on preparing an Uno Platform + LC JS development environment based on our project template. It runs LC JS inside a WebView component based on a static HTML file containing the chart code. Communication between the C# code and JavaScript inside WebView is also possible.
- Install Visual Studio 2019 with required workloads.
– Universal Windows Platform development workload.
– Mobile development with .NET workload.

- Open LC JS Uno Platform template project.
– Open Visual Studio 2019.
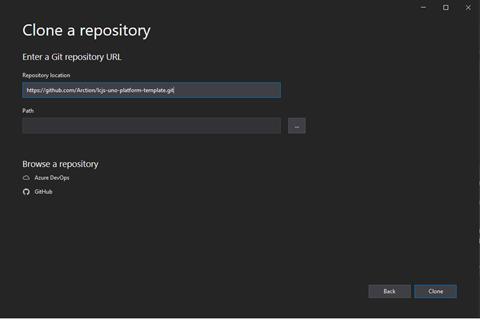
– Select “Clone a repository”.
– To “Repository location”, enter
https://github.com/Arction/lcjs-uno-platform-template.git
– Select “Clone”.
- Install VS Extensions for Uno Platform development.
– Select “Extensions”.
– Select “Manage extensions”.
– Type “uno” into Search bar.
– Select “Download” under “Uno Platform Solution Templates”.

- Close Visual Studio to begin Extension’s installation (VSIX installer should automatically open).
– Select “Modify”.
– After modifications are complete, select “Close”.
– Reopen Visual Studio.
– Select the template project from before, from the recently opened window.
– Open the template solution.
– In Solution Explorer – Folder View, select the solution (.sln file) by double-clicking it.
– This might open a popup window on “Visual Studio update required”, please proceed with this so that required updates are installed.
– This might also open another popup window on “Android SDK license acceptance”, this one you should “Accept”.
– Run solution with WPF (Windows Desktop application).
– Change selected Solution Platform from default (Any CPU) to x64.
– Change selected Startup Project from default (Droid) to UWP (Universal Windows).
– Press the start button which says, “Local Machine”.

- This might open a popup window on Windows Settings For developers. Here you should ensure that the “Developer mode” checkbox is selected.
- This should open a new application window, where you can interact with LightningChart components.

This guide is the minimal setup on integrating LightningChart inside Uno Platform. You can deploy it in the various options available within the Uno Platform, like UWP/WinUI and Android for example.
The chart code can be accessed in Solution Explorer, for example UWP/Assets/sample.html.
The HTML file is linked to the Uno Platform application in Shared/MainPage.xaml/MainPage.xaml.cs.


 Subscribe to Our Blog
 Subscribe via RSS
 Back to Top